
Penerangan
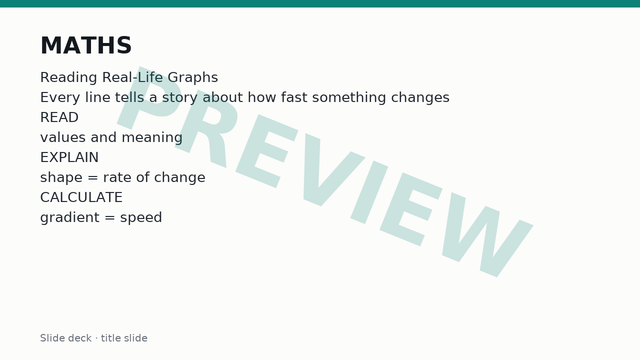
What a real-life graph shows
A real-life graph is a picture of how two measured quantities are related. The horizontal axis shows the independent variable, often time or quantity bought. The vertical axis shows the dependent variable, which changes as a result. Every point on the graph is a pair of values that go together, so the graph can be read in both directions: from the horizontal axis up to the line to find a vertical value, or from the vertical axis across to the line to find a horizontal value.
Before reading any graph, the labels and the scales must be checked. The axis labels name the quantities and give their units. The scale shows what one square or one gridline is worth, and the scales on the two axes are often different. A reading is only correct when the units are quoted with the number.
The main types met at this level are:
- Conversion graphs, which convert between two units or currencies, such as pounds to euros or miles to kilometres.
- Cost graphs, which show the price paid for different quantities or amounts of use.
- Distance-time graphs, which show how far an object has travelled from a starting point as time passes.
In each case the useful skill is the same: read a value accurately, then say what it means in the context of the situation, not just as a number.
Conversion and cost graphs
A conversion graph is a straight line through the origin when one unit is a fixed multiple of the other. If 1 mile is about 1.6 kilometres, then 0 miles is 0 kilometres, so the line starts at (0, 0), and doubling the miles doubles the kilometres. This is called direct proportion. A conversion line that does not pass through the origin, such as the one for degrees Celsius and degrees Fahrenheit, is still linear but is not a case of direct proportion, because 0 in one unit is not 0 in the other.
To use a conversion graph, find the known value on one axis, draw a line across or up to the graph, then draw a second line to the other axis and read off the answer. Readings are estimates, limited by the accuracy of the scale. Large values outside the grid can be found by scaling: if 10 units convert to a known amount, 100 units convert to ten times that amount.
A cost graph shows total cost against quantity or time. Two features matter:
- A line that starts at the origin means there is no charge for zero use, and the cost is proportional to the quantity.
- A line that starts above the origin on the vertical axis has a fixed charge (a standing charge, hire fee or call-out fee) paid before any use. The vertical intercept is that fixed charge.
The steepness of a cost line shows the price per unit. A steeper line means each extra unit costs more. A cost graph can also change slope: a mobile data plan may charge a low rate up to an allowance and a higher rate afterwards, giving a line that bends upward at the allowance. A line that bends to a shallower slope shows a bulk discount.
Distance-time graphs and rate of change
On a distance-time graph, time runs along the horizontal axis and distance from the starting point runs up the vertical axis. The shape of the line describes the journey:
- A straight line sloping upward means constant speed. The steeper the line, the faster the movement.
- A horizontal line means distance is not changing, so the object is stationary.
- A line sloping downward means the object is returning towards the starting point.
- A curve that gets steeper means the object is speeding up, and a curve that flattens means it is slowing down.
The rate of change of one quantity with respect to another tells how quickly the vertical quantity changes for each unit of the horizontal quantity. On a straight section it equals the gradient:
gradient = change in vertical value ÷ change in horizontal value
For a distance-time graph the gradient is the speed. If the line rises from 2 km at 1 hour to 8 km at 3 hours, the distance changes by 6 km in 2 hours, so the speed is 3 km/h. A negative gradient on a distance-time graph means movement back towards the start, and the speed is the size of the gradient, because speed has no direction.
A graph describes a model, not a drawing of the path. A journey that goes up a hill and down again still has distance increasing on the graph, because distance travelled only grows with time. The graph says nothing about the shape of the road. Every explanation of a graph's shape should refer to the rate of change: a steep section means a quantity changes quickly, a shallow section means slowly, and a flat section means not at all.
Other rates follow the same idea. The gradient of a graph of water volume against time is a flow rate, and the gradient of a cost graph is a price per unit.
Graphs with more than one component
Some graphs show two or more lines on the same axes, or one line made of several different sections. Each line or section is a component, and each needs to be read and explained separately.
A graph with several lines compares situations. Two cyclists plotted on one distance-time graph, or two phone tariffs plotted on one cost graph, can be compared at any value on the horizontal axis by reading both lines at that value. The line that is higher at a given time has gone further (or costs more). The line that is steeper has the greater rate of change.
The point where two lines cross is an intersection. At that point both lines have the same horizontal value and the same vertical value, so the two situations are equal there. The meaning depends on the context:
- On a distance-time graph for two travellers, the intersection is the time at which both are at the same distance from the start. If they travel in opposite directions between two towns, this is the time and place at which they pass each other.
- On a cost graph for two companies, the intersection is the quantity at which both charge the same total. Below it one company is cheaper, above it the other is cheaper, so the intersection is the point at which the better choice changes.
A single line made of several straight sections is read section by section. Each section has its own gradient, and each change of gradient marks a change in the situation, such as a rest, a change of speed or a change of price band. Explaining a shape means stating, for each section, whether the rate is high, low, zero or negative, and giving the real-world reason.
The two lines in a comparison must share the same axes and scales. Two graphs drawn on different scales cannot be compared by looking at steepness alone.
Compound measures
A compound measure combines two different quantities into one by division, so its unit contains the word "per" or a slash. The most common are:
- Speed = distance ÷ time, in units such as km/h or m/s.
- Density = mass ÷ volume, in units such as g/cm³.
- Price per unit = cost ÷ quantity, in units such as £ per kilogram.
- Flow rate = volume ÷ time, in units such as litres per minute.
Rearranging gives the other forms: distance = speed × time and time = distance ÷ speed. A common aid is a triangle with distance on top and speed and time below, but the relationship is understood best as the gradient formula: speed is the change in distance for each unit of time.
The units of the answer must match the units of the inputs, so a distance in metres and a time in minutes give metres per minute. Changing km/h to m/s needs two conversions: multiply by 1000 to change kilometres to metres, then divide by 3600 to change hours to seconds. Dividing by 3.6 does both at once.
A average speed for a whole journey is total distance ÷ total time, including any time spent stationary. It is not the mean of the speeds on different sections unless the time spent on each section is equal.
Compound measures allow fair comparison when quantities differ in size. Two buses cannot be compared by distance alone if their times differ, but their speeds can be compared directly. Two packs of rice of different weights are compared by price per kilogram. On a graph, the compound measure is the gradient, so a steeper line always means the larger measure.
Drawing and comparing graphs
Drawing a real-life graph follows a fixed routine:
- Decide which quantity is independent and place it on the horizontal axis.
- Choose scales that use most of the paper, with equal steps along each axis, and label both axes with the quantity and its unit.
- Plot the key points: the start, every point where the situation changes, and the end.
- Join the points with straight lines where the rate is constant, using a ruler. A smooth curve is used only where the rate changes gradually.
For a journey described in words, each stage is converted into a point. A cyclist who rides 12 km in the first hour, rests for half an hour and then rides a further 18 km in the next 1.5 hours gives the points (0, 0), (1, 12), (1.5, 12) and (3, 30). The rest is a horizontal section, and the speeds are 12 km/h and 18 ÷ 1.5 = 12 km/h.
Two graphs are compared using compound measures calculated from them. To compare two cost lines, find the price per unit from each gradient and the fixed charge from each intercept, then locate the intersection. To compare two journeys, calculate the speed of each section from its gradient and the average speed from the total distance and total time. A full comparison states the numbers and then the conclusion in context, for example "the first company is cheaper for fewer than 8 units because its fixed charge is lower, but its price per unit is higher, so the second becomes cheaper beyond 8 units".
A good interpretation always ends with a sentence in context. Giving a gradient of 3 is incomplete; stating that the speed is 3 km/h, or that each extra unit costs £3, completes the answer.